Analyzing Core web vitals: A Case Study


Introduction: Analyzing Website Performance with Developer Tools
Website performance analysis can seem daunting, but it doesn't have to be. This article will show you a practical, hands-on approach using developer tools. We'll delve into key metrics like the Largest Contentful Paint (LCP) and Cumulative Layout Shift (CLS), discuss how to gather and interpret field data, and provide insights on utilizing the Google Chrome User Experience Report (CrUX). Let's dive right in!

Collecting and Understanding Data with PageSpeed Insights
Google's PageSpeed Insights is an invaluable tool for analyzing your website's performance. This tool provides two types of data: field data and lab data.
Field data is real-world data collected from actual users interactions with your website. This data provides insight into how your site performs under various real-world conditions. It's gathered from users who anonymously report performance data through their Chrome browsers. Key metrics to focus on include the Largest Contentful Paint (LCP) and Cumulative Layout Shift (CLS).
PageSpeed Insights also offers lab data, which is collected in a controlled environment using Lighthouse, an open-source, automated tool for improving web page quality. This controlled environment allows for consistent, repeatable tests under predefined conditions such as network throttling to simulate different network speeds, and CPU throttling to simulate various device capabilities.
Field data is real-world data collected from actual users interactions with your website.
Analyzing both field and lab data can give you a comprehensive understanding of your website's performance. However, it's important to note that the results from lab and field data can greatly vary due to the differences in testing conditions. These discrepancies, and why they occur, will be explored with a real-world example in the next section.
Remember, the objective is to leverage these insights to identify areas where your site excels and where improvements might be needed, aiming to enhance the overall user experience.
it's important to note that the results from lab and field data can greatly vary due to the differences in testing conditions
Real-World Example: Analyzing Performance of Steimatzky's Website

Let's take a real-world example to better understand how we can use the data from PageSpeed Insights. For our case study, we'll look at Steimatzky, a famous Israeli bookstore chain. They have a prominent online presence, with a well-designed website where customers can browse and purchase books. We'll be using PageSpeed Insights to analyze the performance of this website.
For our case study, we'll look at Steimatzky, a famous Israeli bookstore chain. They have a prominent online presence, with a well-designed website where customers can browse and purchase books
By inputting Steimatzky's URL into PageSpeed Insights, we can get a detailed report on the website's performance, providing both lab and field data. Keep in mind that the results from these two sources can greatly vary due to the differences in testing conditions. Understanding why these discrepancies occur will be our key focus in this section.
So, let's dive into the analysis and see what insights we can gather!
Field Data: Insights from Real-World User Interactions
Lab Test: Performance Results from Lighthouse
Analyzing the Discrepancy: Field Data vs. Lab Data
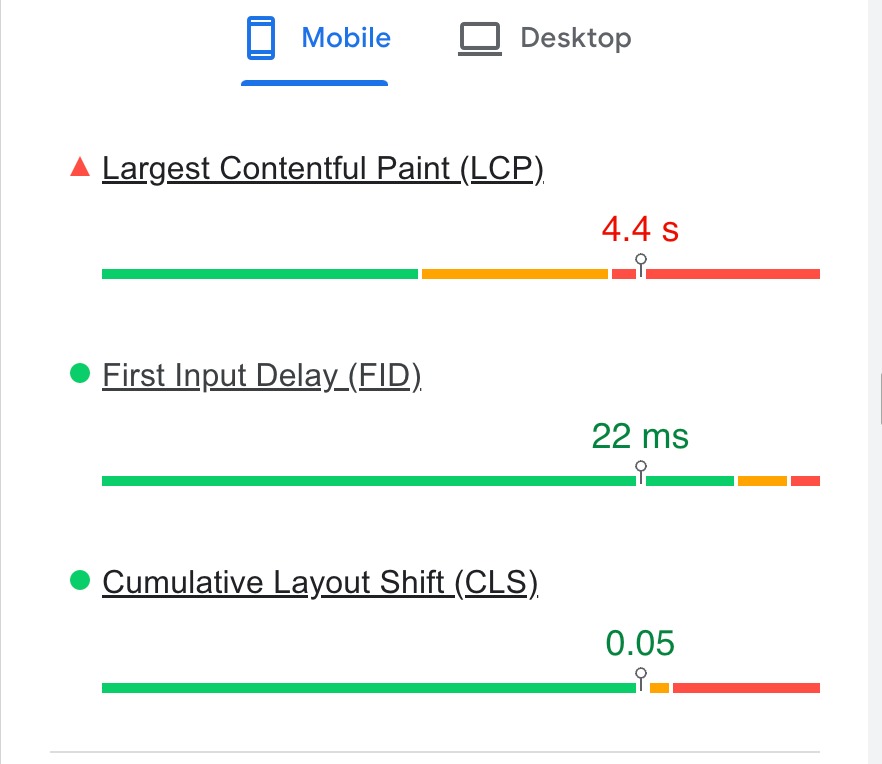
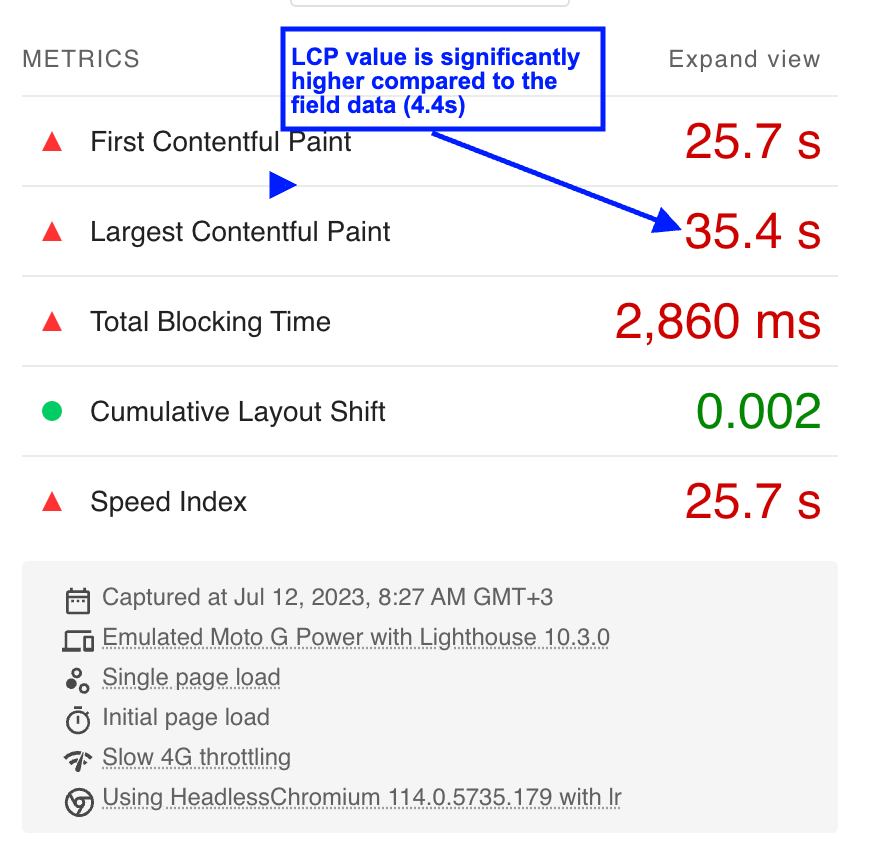
When comparing the field data and the lab data obtained through Lighthouse, a significant gap becomes apparent. The field data shows a Largest Contentful Paint (LCP) value of 4.4 seconds, while the lab test results indicate an LCP value of 35 seconds. This stark difference raises questions about the factors contributing to such a divergence.
The lab test, with its simulated throttling conditions, provides insights into how the website performs under specific constraints. However, it is important to note that these conditions may not accurately reflect the real-world experience of users visiting the site. The field data, on the other hand, represents the actual performance observed by users, capturing a more authentic perspective.
Despite the gap between the field data and the lab test results, it's crucial to acknowledge that the website still falls significantly short of meeting its web vitals goals, particularly in terms of LCP. The field data LCP value of 4.4 seconds exceeds the recommended goal of 2.5 seconds for the 75th percentile of users, as outlined by Google. This highlights the need to further investigate the performance issues impacting the website.
In the next sections, we will delve deeper into the possible factors contributing to this gap and explore why, despite the favorable audience with strong network conditions and powerful devices, the website still struggles to meet the recommended LCP goal.
Analyzing Metrics and Optimizing LCP
In order to address the high LCP and improve the website's performance, it's essential to examine various metrics that can impact LCP. By using Google Chrome DevTools, we can measure and analyze these metrics to identify areas for optimization. Here are the key metrics and steps to consider.
Assessing the Initial Document Downloaded by the Browser
Improving the performance of a website is a continuous process, and a key metric to focus on is the Largest Contentful Paint (LCP) score. The LCP score measures the point in the page load timeline when the page's main content has likely loaded—a fast LCP helps reassure the user that the page is useful. Currently, the LCP score for our site is not up to the mark, so we're going to delve deeper into various metrics to understand how we can enhance this.
1. Starting with the Document Request
We will focus on one of the product pages. The document request is the entry point to the process of rendering a page. When a user navigates to a URL, the browser requests an HTML document, which then initiates a series of network requests for various resources. By examining this initial document request, we can get an insight into the potential bottlenecks affecting our LCP score.
2. Examining the Request
To begin this analysis, open your browser's Developer Tools. You'll want to focus on the 'Network' tab, and specifically, you'll want to filter for 'doc' type requests. This will isolate the requests related to the HTML document that is the starting point of the page load.
3. Analyzing the Size
One key aspect of the document request to pay attention to is the size of the document
One key aspect of the document request to pay attention to is the size of the document. The size, as we see, is roughly around 56KB, which falls within the range of reasonable sizes for an HTML document. This size represents the amount of data that had to be downloaded to receive the HTML. Depending on various factors, including your server's location and the user's network speed, the size of your document could impact the time it takes for the main content to become visible, and thus the LCP score. 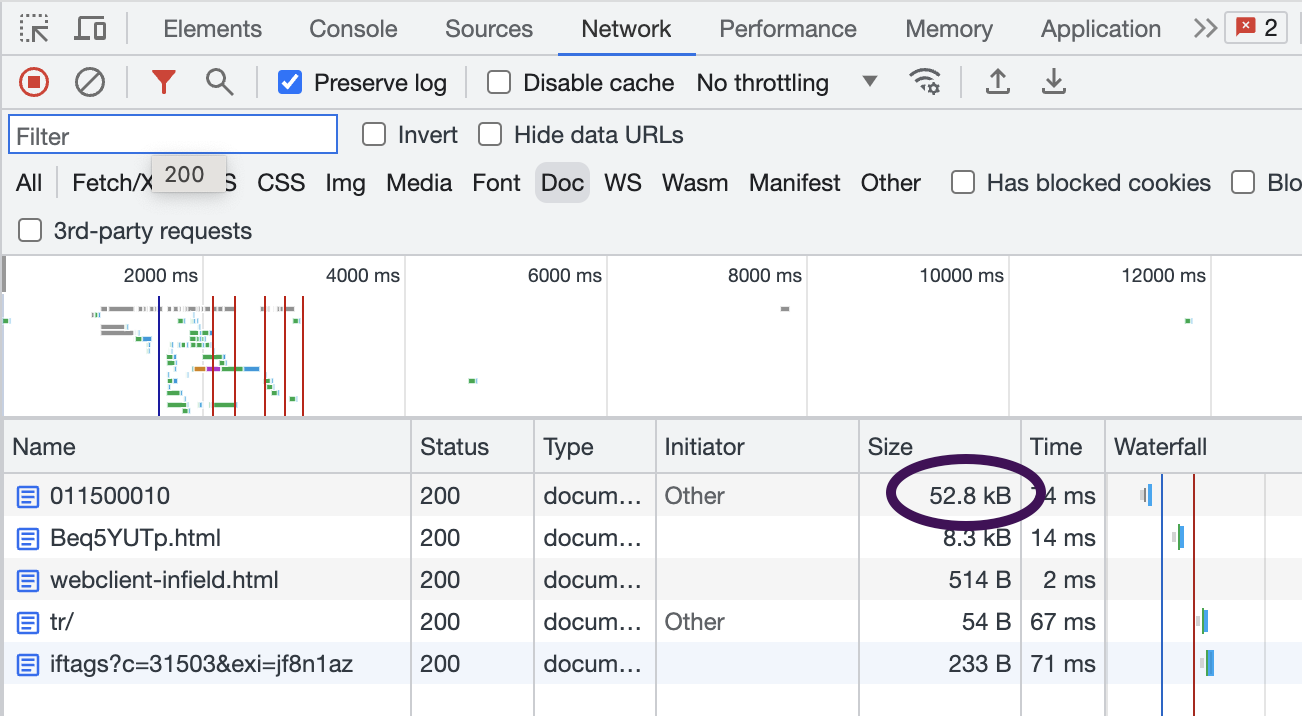
4. Verifying the Download Speed
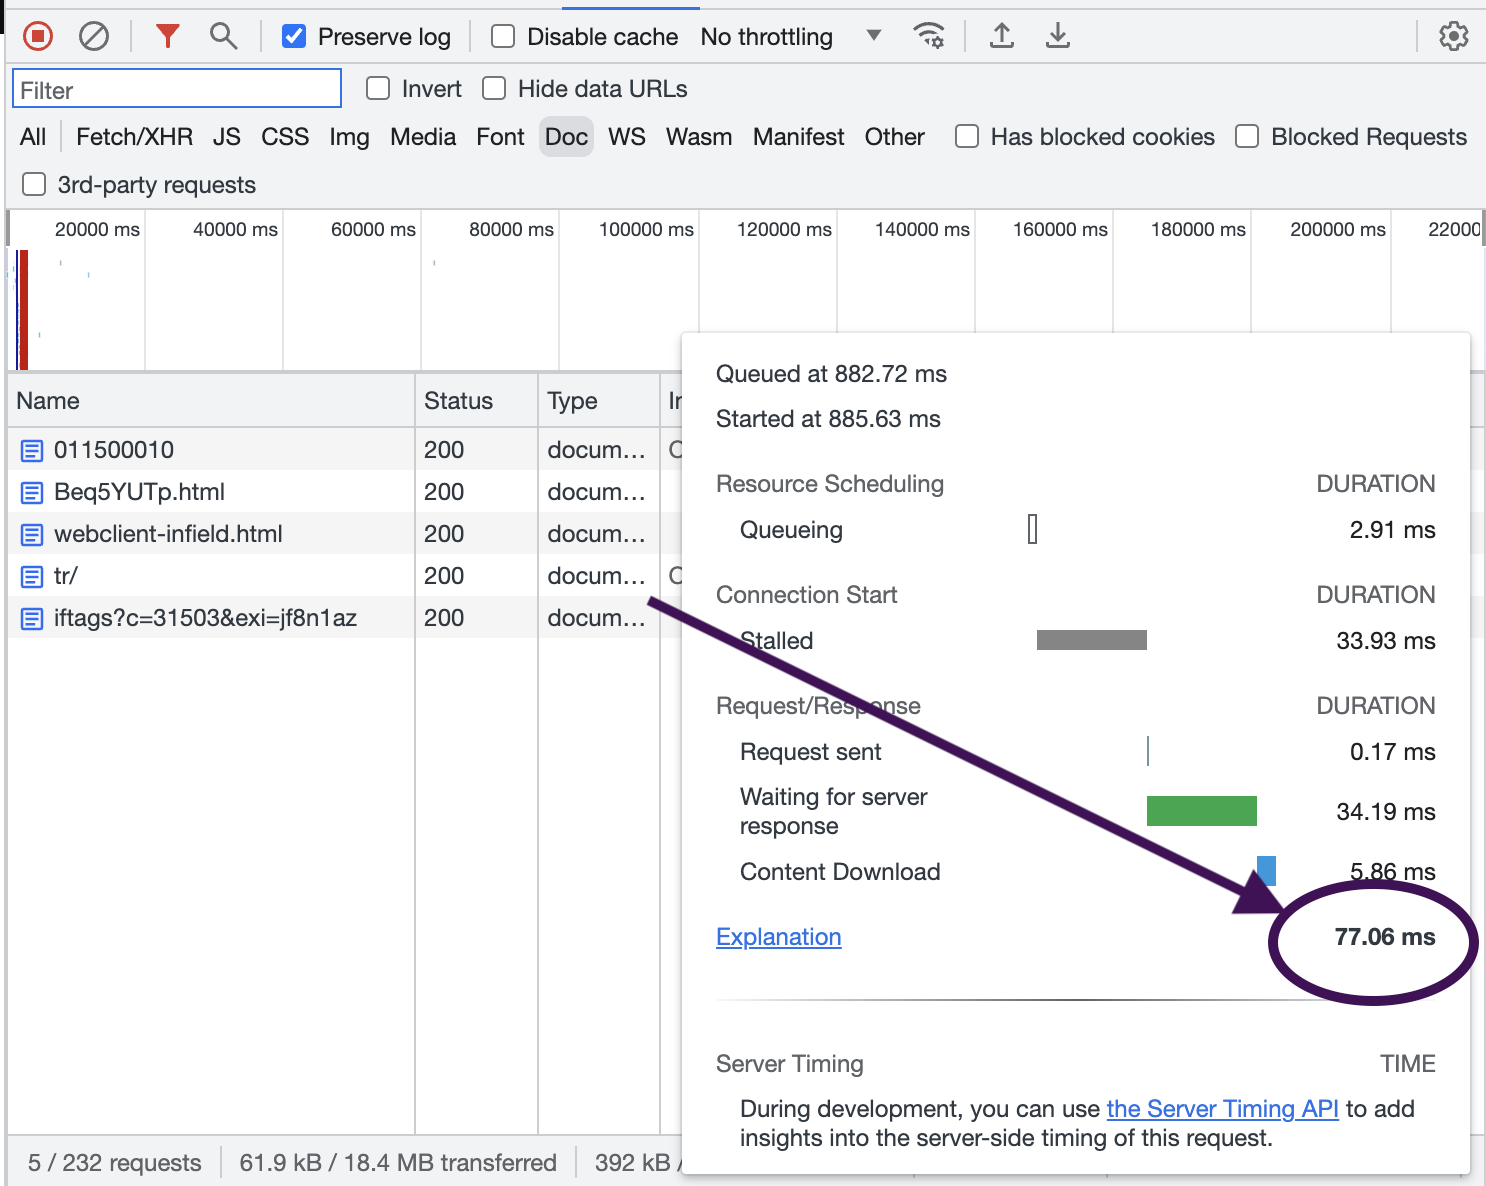
Another crucial factor to examine is the speed of the document download. In our case, we see that the download finishes in about 47ms, which is a very low value. This suggests that the server serving the document is located quite close to my location, meaning that it's likely either a CDN or an Israeli website, given that I'm checking from Israel. Regardless, this quick download speed is a good sign for our performance.
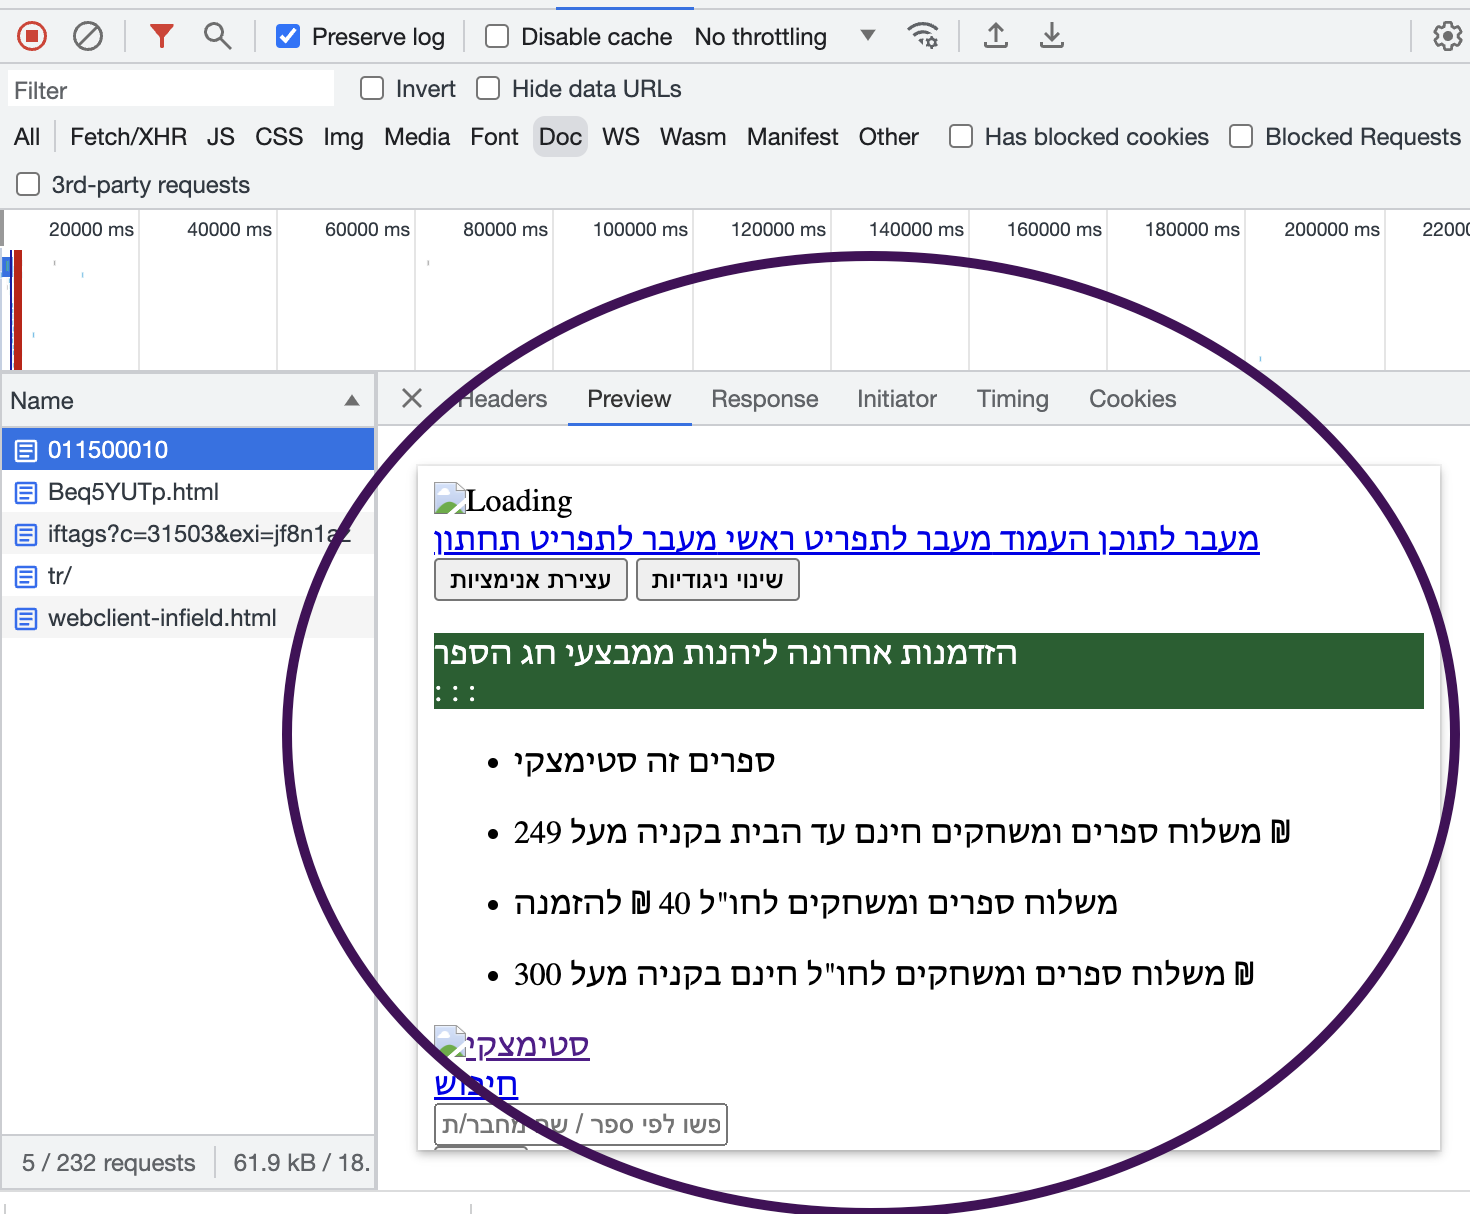
5. Previewing the Document
After identifying the document request, it's also insightful to preview the document to understand what it contains. In our case, the HTML document is arriving without any styles—it's just plain text. This indicates that additional network requests are needed to fetch the styles, which could be impacting our LCP score. These observations provide starting points for optimizing the performance.
Remember, assessing the document request is just the beginning. To comprehensively improve the page load performance, we'll also need to examine other resources like JavaScript, CSS, and images.
6. Checking for Blocking Resources
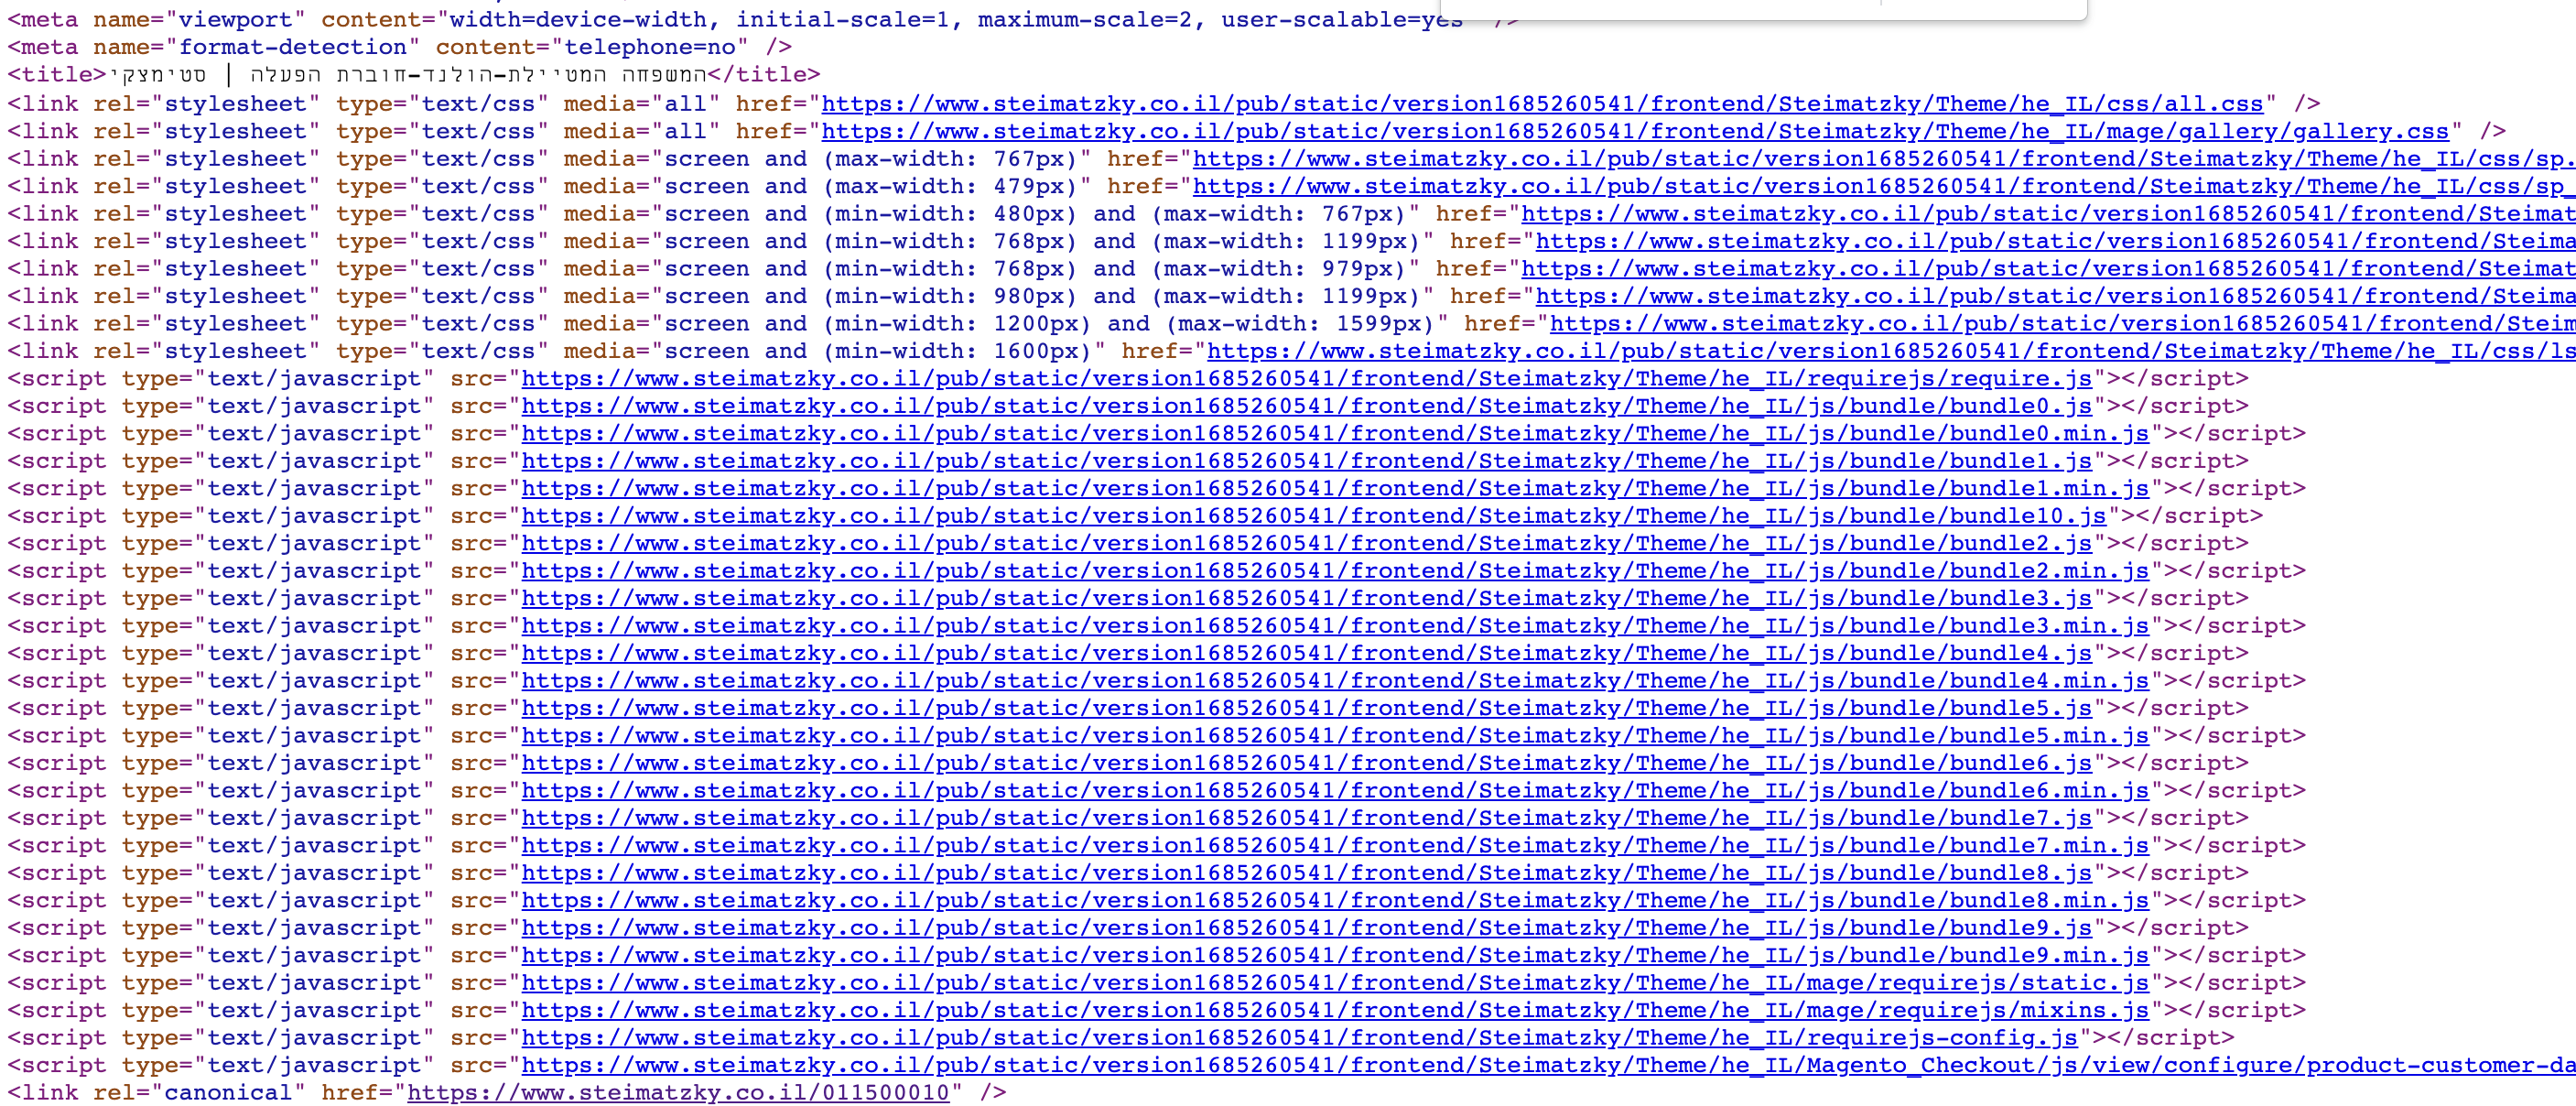
Checking for Blocking Resources: By viewing the source of the HTML document in the browser, we can identify any resources that might be blocking the rendering of the page. In the 'head' of the document, you may find multiple resources that need to be fetched before the page can start rendering. These are known as 'blocking resources' and they can significantly impact your LCP score.
In the 'head' of the document, you may find multiple resources that need to be fetched before the page can start rendering
It's worth noting that resources such as CSS and JavaScript are considered 'render-blocking' because the browser must fully download and process these resources before it can begin to render the page. In contrast, resources like images are not render-blocking—they don't prevent the browser from rendering the rest of the page as they download.
Fortunately, there are ways to prevent resources from blocking rendering. For example, you can add attributes like "defer" to your script tags, which will instruct the browser to continue parsing the HTML while the script is being downloaded, thus not blocking the rendering process.
Inspecting the Largest Contentful Paint (LCP) Element - The Image
In many cases, the LCP element on a page - the element that should be rendered to reach the LCP milestone - is an image. It's therefore crucial to ensure that images are optimized for fast download, as they can significantly impact a page's load performance and thus the LCP score. 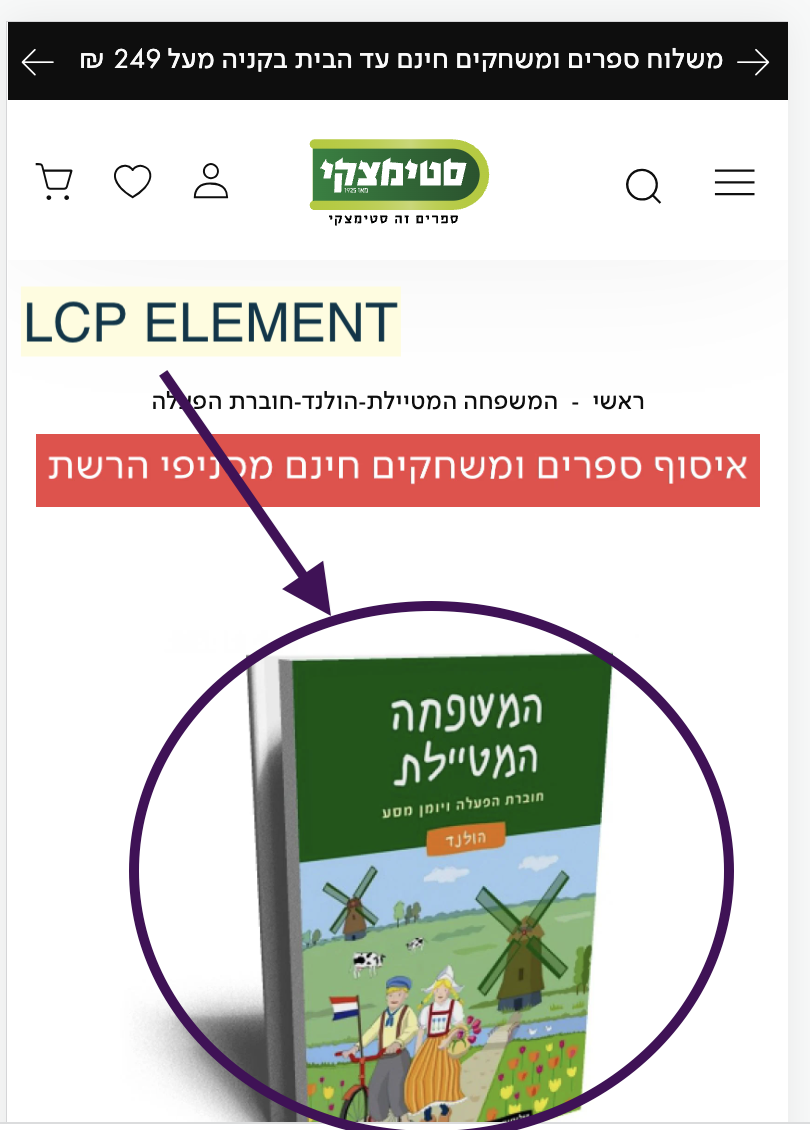
Understanding Next-Gen Image Formats
There has been a push in recent years towards using next-gen image formats, such as WebP, JPEG 2000, and JPEG XR. These formats offer superior compression and quality characteristics compared to older formats like JPEG and PNG. By using these formats, you can significantly reduce the size of your images, leading to faster download times and a better user experience.
It's also important to ensure your images are appropriately sized. Serving overly large images can lead to unnecessary data usage and slow down page load times. By resizing your images to match the dimensions at which they're displayed on your site, you can reduce their file size without impacting their visible quality.
Inspecting the Image
Inspecting the Largest Contentful Paint (LCP) Element - The Image
In many cases, the LCP element on a page - the element that should be rendered to reach the LCP milestone - is an image. It's therefore crucial to ensure that images are optimized for fast download, as they can significantly impact a page's load performance and thus the LCP score.
Understanding Next-Gen Image Formats
There has been a push in recent years towards using next-gen image formats, such as WebP, JPEG 2000, and JPEG XR. These formats offer superior compression and quality characteristics compared to older formats like JPEG and PNG. By using these formats, you can significantly reduce the size of your images, leading to faster download times and a better user experience.
It's also important to ensure your images are appropriately sized. Serving overly large images can lead to unnecessary data usage and slow down page load times. By resizing your images to match the dimensions at which they're displayed on your site, you can reduce their file size without impacting their visible quality.
Inspecting the Image
- Obtain the image's address. You can do this by right-clicking on the image and selecting "Copy Image Address".
- Go to the address in your browser. Here, you can use Developer Tools to inspect the image's properties, such as its size, which in our case the LCP image is roughly around 80KB.
The LCP image is roughly around 80KB
- Check the format of the image. The image is not served in a next-gen format.
The image is not served in a next-gen format
- Consider the potential for optimization. By converting this image to a next-gen format and optimizing its size, we could potentially halve its file size. There are several free tools available online that can help with this image optimization.
- Examine the loading strategy for images. There are multiple images on this page, none of them appear to be optimized, and all these images are fetched immediately upon page load. This could significantly overload the user's bandwidth.
- Consider implementing lazy loading. A technique called 'lazy loading', where images are only loaded as they come into the user's viewport, can improve initial page load performance and save data for users who don't scroll all the way down on your page.
Conclusions
The process of optimizing a website's performance is a journey, not a destination. By focusing on the Largest Contentful Paint (LCP) score, we can identify potential bottlenecks and take steps to improve our site's performance.
-
Remove Excessive Blocking Resources: Through our exploration, we've seen that blocking resources can significantly delay rendering of the page, affecting the LCP score. It's important to limit the number of these resources and block rendering only for critical assets.
-
Optimize Images: Images, often being the LCP element, can significantly affect performance, especially if they're not properly optimized. Using next-gen image formats and appropriately sizing images can significantly improve page load performance.
-
Implement Lazy Loading: Offscreen images should be loaded lazily, meaning they're loaded only as they come into the user's viewport. This technique can improve initial page load performance and save data for users who don't scroll all the way down on your page.
These are just some of the many strategies to optimize web performance. To further improve our LCP score and overall performance, we should continue to monitor, test, and tweak our website as necessary. It's a continuous process, but the rewards of a faster, more efficient website are well worth the effort.